The Donation Golden Visa in numbers
The Ministry of Culture's own figures show a route that has moved, in three years, from the margins of the Golden Visa programme to one of its most dynamic parts.
Source: GEPAC, Ministry of Culture, data to 31 August 2026.
- €104.7MDonated to Portuguese culture through the route, 2020 to 31 August 2026
- 479Investment declarations issued by GEPAC, one per donor
- 141Cultural activities approved as eligible
- 11×Growth in amount donated from 2023 to 2025
How much has been donated through the route?
€104.7 million was donated to Portuguese culture through the route between January 2020 and 31 August 2026. GEPAC issued 479 investment declarations, one per donor, for 141 cultural activities approved as eligible.
How fast is the route growing?
2025 was the record year, with 213 declarations and €47.3 million, up 303% on 2024. By 31 August 2026 the route had already reached 184 declarations and €37.8 million.
€ million, GEPAC official data. 2026 to 31 August.
See the figures: declarations and amount by year
| Year | Declarations | Amount donated |
|---|---|---|
| 2020 | 1 | €0.25M |
| 2021 | 8 | €1.7M |
| 2022 | 7 | €1.7M |
| 2023 | 16 | €4.2M |
| 2024 | 50 | €11.75M |
| 2025 | 213 | €47.3M |
| 2026 (to 31 August) | 184 | €37.8M |
| Total | 479 | €104.7M |
Where do donors come from?
Donors from the United States and China account for almost two thirds of all declarations. India is third, with 46.
Share of 479 declarations, 2020 to 31 August 2026.
See the figures: declarations by nationality
| Nationality | Declarations | Share |
|---|---|---|
| United States | 162 | 33.8% |
| China | 149 | 31.1% |
| India | 46 | 9.6% |
| Turkey | 16 | 3.3% |
| United Kingdom | 11 | 2.3% |
| Russia | 9 | 1.9% |
| Others | 86 | 18.0% |
| Total | 479 | 100% |
Where does the money go?
Most of the money goes to heritage and to Portugal’s interior. Recovery and maintenance of national heritage has received 58% of the amount donated, and low-density territories, where the donation is €200,000, have also received 58%.
€104.7M, 2020 to 31 August 2026.
By cultural area
By territory
See the figures: cultural area and territory
| Cultural area | Approved activities | Share | Amount donated | Share |
|---|---|---|---|---|
| Recovery or maintenance of national heritage | 70 | 49.6% | €60.9M | 58.1% |
| Artistic production | 71 | 50.4% | €43.9M | 41.9% |
| Total | 141 | 100% | €104.7M | 100% |
| Territory | Approved activities | Share | Amount donated | Share |
|---|---|---|---|---|
| Low-density territories (€200,000) | 61 | 43.3% | €61.0M | 58.3% |
| Standard territories | 80 | 56.7% | €43.7M | 41.7% |
| Total | 141 | 100% | €104.7M | 100% |
€ million, 2020 to 31 August 2026.
See the figures: approved activities and amount by region
| Region | Approved activities | Amount donated | Share of amount |
|---|---|---|---|
| Centro | 30 | €37.4M | 35.7% |
| Norte | 53 | €30.5M | 29.1% |
| Alentejo | 8 | €16.2M | 15.5% |
| Grande Lisboa | 38 | €13.7M | 13.1% |
| Oeste e Vale do Tejo | 4 | €6.5M | 6.2% |
| Itinerant | 6 | €0.4M | 0.4% |
| Algarve | 2 | €0 | 0.0% |
| Total | 141 | €104.7M | 100% |
Based on GEPAC data, the average amount per approved activity is about €1.00M in low-density territories against €0.55M in standard territories, and about €2.03M in the Alentejo.¹
¹ Cascais Ventures calculation on GEPAC's official figures.
Who receives the donations?
Private foundations of public utility are the largest group of beneficiaries, with 55% of approved activities. Municipal and intermunicipal entities, the state-owned sector and public foundations account for most of the rest. The full breakdown is on The Donation Golden Visa explained.
What share goes to Cascais Ventures projects?
Almost 30% of all donations made under the route since 2020 have gone to projects produced by Cascais Ventures. Those projects span heritage rehabilitation, such as Palacete Fundação Alentejo, film and documentary, such as A Volta do Elefante, and artistic programmes, such as Geografia Criativa.
- Almost 30%Of all programme donations made in Cascais Ventures projects
- 10Cultural projects approved by the Ministry of Culture, a 100% approval rate
What do these figures count?
GEPAC issues one investment declaration per donor once the donation is transferred, so 479 is the number of donors. Family members included in a residence application are not in these counts.
AIMA’s residence permit figures count every family member and are published later, so they always differ from GEPAC’s.
How to cite these figures
This page is the ARI Cultural Monitor: the official GEPAC figures for the cultural donation route, kept in one place and updated each time GEPAC releases new data.
- Source: GEPAC, Ministry of Culture. Only official data is used; press and aggregator figures are not mixed in.
- Period: 1 January 2020 to 31 August 2026.
- Unit: one investment declaration per donor, issued once the donation is transferred. Family members are not counted.
- Our calculations: shares and growth rates are Cascais Ventures calculations on the official totals, marked with a note where they appear.
- Next update: on GEPAC's next release.
To cite: Cascais Ventures, ARI Cultural Monitor, based on GEPAC official data to 31 August 2026, cascaisventures.com/monitor/numbers/.
Source: GEPAC (Gabinete de Estratégia, Planeamento e Avaliação Culturais), Ministry of Culture, official data for 1 January 2020 to 31 August 2026, presented at GEPAC's public information session at the Centro Cultural de Belém, Lisbon, 28 September 2026. Figures rounded for display; totals from the unrounded official data.
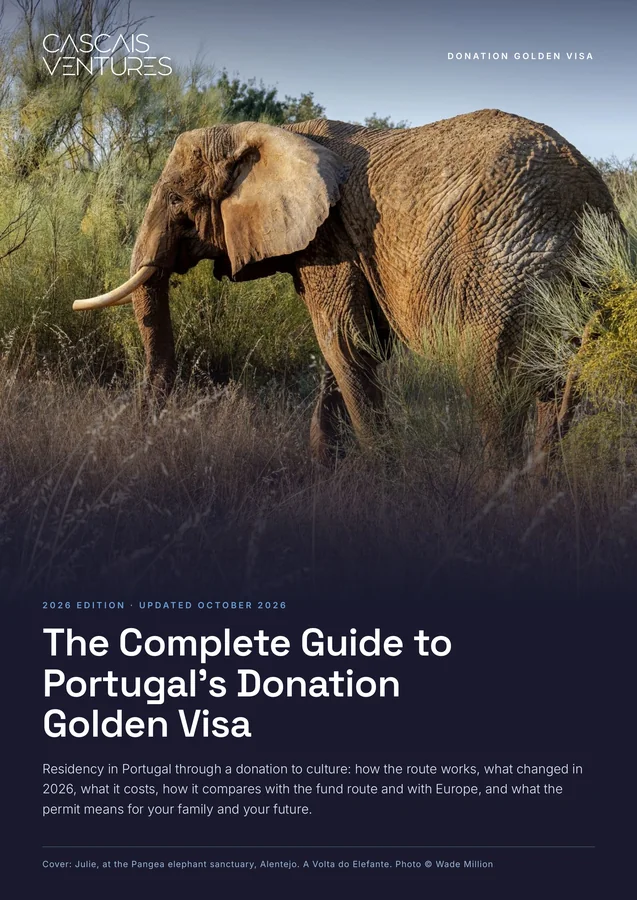
Free guide
The Complete Guide to Portugal's Donation Golden Visa
The route, the costs, donation vs fund, and the projects. Free.
- How the route works, and what changed in 2026
- Government fees, with a family-of-four example
- GEPAC's figures, and the projects
Keep exploring
Updated 9 October 2026 · Cascais Ventures · Primary sources linked on this page (links checked 9 October 2026)